
Next Full index is due to be released:
13th February 2018

HOUSE PRICE INDEX REPORT
Headline statistics
For November 2017:
-
•the average price of a property in England was £226,071
-
•the annual price change of a property in England was 5.1%
-
•the monthly price change of a property in England was 0.1%
-
•the index figure for England (January 2015 = 100) was 118.6
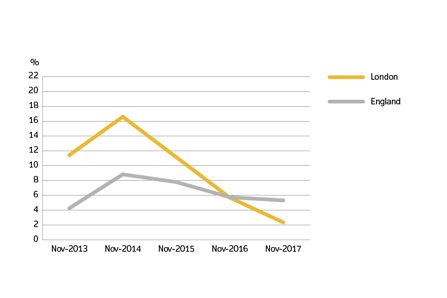
UK house prices grew by 5.1% in the year to November 2017, experiencing a 0.3 percentage point decrease from the previous month.
Economic statement
The Royal Institution of Chartered Surveyors’ (RICS) UK Residential Market Survey for November 2017 (PDF, 598KB) reported that their headline near term price expectations series rose to -5% from -10% in October, meaning three month expectations are now more or less flat at the national level. Similarly, the new buyer enquiries series stabilised with a net balance of -5% of respondents noting a decline in demand (as opposed to an increase), up from -19% in October.
The UK Property Transaction Statistics for November 2017 (PDF, 825KB) showed that the number of seasonally adjusted transactions on residential properties with a value of £40,000 or greater has increased by 7.1% in the year to November 2017. Between October 2017 and November 2017, transactions increased by 0.6%.
The Bank of England’s Agents’ summary of business conditions (PDF, 713KB) reported that activity moderated in the final quarter of 2017, with demand remaining weak in the secondary market, the new builds market and in London.
Looking at the regional level, the largest annual price growth was recorded in the West Midlands at 7.2%, up from 7.1% in October 2017. It was followed by the East Midlands at 6.4%. At 2.3%, both London and the North East region showed the slowest annual growth of all UK regions. This is the 12th consecutive month where the annual growth in London has remained below the UK average.
On the supply side, RICS reported that their net balance for new instructions remained negative for the 23rd consecutive month. Stock levels reported by estate agents remained stable.
Price change
Annual price change
Annual price change for England and London over the past 5 years
January 2018
Next Full index is due to be released:
21st March 2018

HOUSE PRICE INDEX REPORT
Headline statistics
For December 2017:
-
•the average price of a property in the UK was £226,756
-
•the annual price change for a property in the UK was 5.2%
-
•the monthly price change for a property in the UK was 0.4%
-
•the monthly index figure (January 2015 = 100) for the UK was 118.9
Estimates for the most recent months are provisional and are likely to be updated as more data is incorporated into the index. Read Revisions to the UK HPI data.
Economic statement
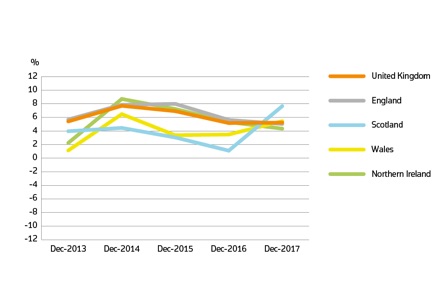
UK house prices grew by 5.2% in the year to December 2017, up from 5.0% in the year to November 2017.
The Royal Institution of Chartered Surveyors’ UK Residential Market Survey for December 2017 (PDF, 633KB) reported their near term price expectations series remained negative at -6%. Having stabilized in the previous report, the new buyer enquiries edged lower with a net balance of -15% of respondents noting a decline in demand (as opposed to an increase), compared with -5% in November.
The UK Property Transaction Statistics for December 2017 (PDF, 829KB) showed that the number of seasonally adjusted transactions on residential properties with a value of £40,000 or greater has decreased by 0.1% in the year to December 2017. Between November 2017 and December 2017, transactions decreased by 3.9%.
On the supply side, the Royal Institution of Chartered Surveyors reported their net balance for new instructions remained negative for the 24th consecutive month. Stock levels reported by estate agents remained broadly stable; still close to historic lows. Their three month outlook for national sales expectations remained flat, whilst there is greater optimism for the twelve month outlook.
Looking at English regions, the largest annual price growth was recorded in the South West at 7.5%, up from 6.1% in the previous month. It was followed by the East and West Midlands, both growing at 6.3%. At 2.5%, London showed the slowest annual growth of all UK regions, though this is up from 2.0% in the previous month. This is the 13th consecutive month where the annual growth in London has remained below the UK average. Yorkshire and The Humber was the second slowest region, growing at 2.8%.
Price changes
Annual price change
Annual price change for UK by country over the past 5 years
February 2018
3rd March 2018
Event
Sheridans
89 Whiting Street
Bury St Edmunds
Suffolk
IP33 1NX
t: 01284 700 018
BURY ST EDMUNDS OFFICE
Sheridans
The Stables Hall Street
Long Melford
Suffolk
CO10 9JT
t: 01787 466 566
LONG MELFORD OFFICE
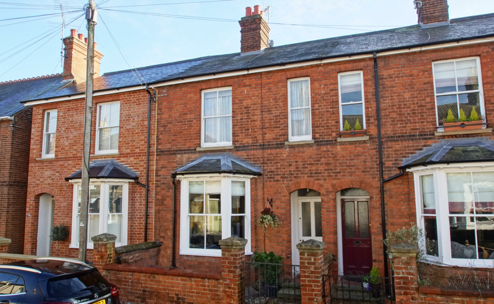
OPEN HOUSE
Southgate Green, Bury St Edmunds, Suffolk
** OPEN HOUSE - Saturday 3rd March
12 noon - 2pm - By appointment only **
t: 01284 700 018
£395,000
Short walk to town of Bury St Edmunds, Suffolk
• Spacious and well presented
• Three bedrooms
• Modern ensuite to master bedroom
• Large Kitchen/dining room
• Sitting room
• Study/Family room
• Converted cellar/office/cinema room
• Garden laid mainly to lawn
7th & 8th April 2018
Event


BIDEFORD OFFICE
Morris and Bott
Grenville Wharf
6a The Quay
Bideford
Devon
EX39 2HW
t: 01237 459 998

OPEN HOUSE
£325,000
Apartment 2, The Pines, 76 Atlantic Way, Westward Ho!, Devon


-
•OPEN WEEKEND 7th & 8th APRIL 2018
-
•Stunning Coastal Views
-
•Sympathetically Refurbished
-
•High Specification
-
•Character Features
-
•Private Terrace
-
•Off-Road Parking
-
•Communal Gardens
-
•Ideal Second Home/Holiday Let
News
News